Spatial Reprojection
Reprojection in GIS
Reprojection is often confusing to users new to GIS, and while ThinkGeo APIs make it easy to switch between projections, it’s good to illustrate why you would need to. We first have to consider how to turn locations on a 3D globe into a flat 2D representation, and this starts with the 'decimal degrees' system. Decimal degrees is an ingenious system where points on a sphere are mapped based on their relative angle from a single point inside the center of the sphere. Imagine you are in the center of the sphere and you start with an arbitrary reference point of 0.0 X and 0.0 Y (For the Earth, this point is off the coast of Africa, at the equator). How would you represent the location of a place like Chicago? From our (0,0) reference point, you would rotate 41.87 degrees on the north/south axis and 87.62 degrees on the east/west axis. From here, projecting a point towards the outside of the sphere gives us the location of Chicago.
While this system is great for accurately representing points on a globe, locations are often not the only thing we care about. In GIS, we want to solve other problems like calculating accurate distances between points, finding the area of a polygon, or accurately representing angles of real world entities like countries. While any particular projection can give you a few those things, no single 2D projection can give you all of them at the same time for the entire world.
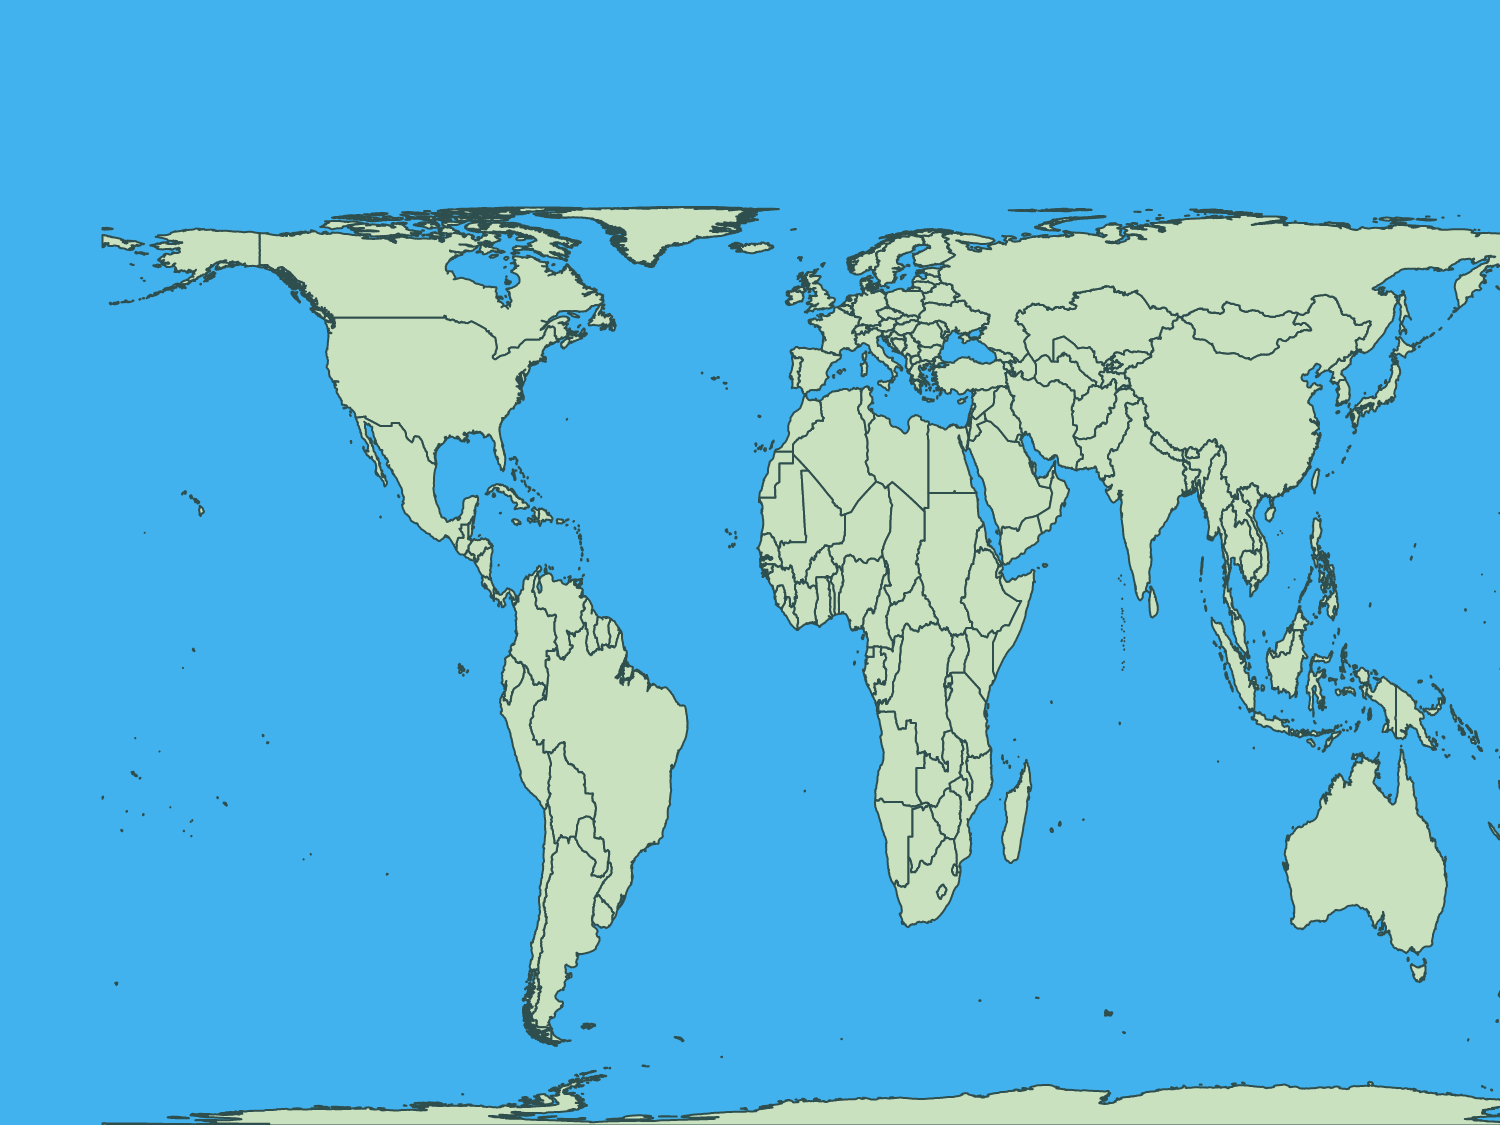
Because no projection is perfect, you have to choose a projection based on where you are and what is important to you. A perfect example of this is the Spherical Mercator projection, which is used by Google Maps, Bing Maps, and nearly all online mapping companies. This projection is a good middle ground when you want to display the world with a fairly accurate representation of most countries. However, it becomes very weak around the poles, and you can easily see this with Greenland and Antarctica.
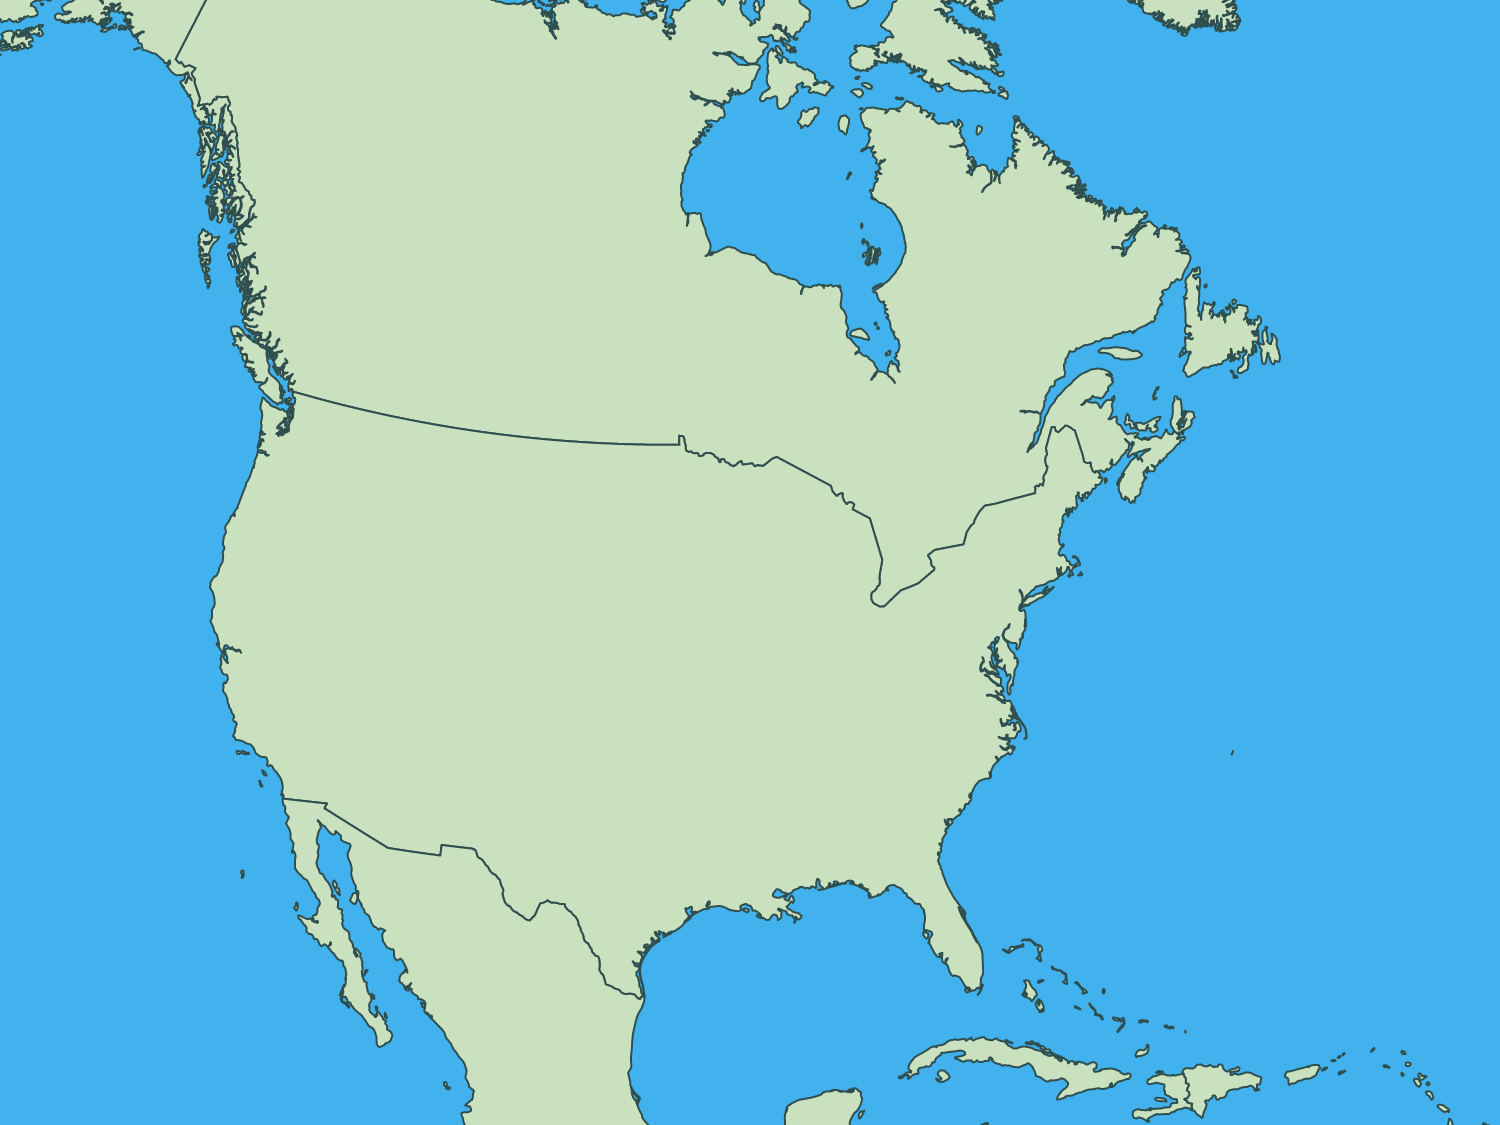
Different countries have national projections that focus on displaying their country with the least number of tradeoffs, at the expense of other countries. An example of this is in the United States, where a set of projections called 'State Plane' are used for display and measurement based on the region of the country you are in. North Texas might have a slightly different State Plane projection than Central Texas, because these are used for land surveying and are highly tuned for that exact part of the world.
While most of you will be using Spherical Mercator because it’s a decent projection for North America, it’s important to realize that distances will not be as accurate as with a local State Plane projection, and you need to keep this in mind. If your app requires very accurate measurements you may consider using a different projection, at least for calculations. For example, you might use Spherical Mercator to display your maps, but when a user uses a tool to measure distance, you convert the coordinates from Spherical Mercator to State Plane or UTM and calculate the distance based on those reprojected points.
Hundreds of Supported Projections
At our core our APIs use PROJ, a well known open source projection system which has support for hundreds, if not thousands, of projections. We also provide many APIs to help you easily find the projection you need based on SRID or PROJ projection string. A comprehensive list can be found here.
Sample Code

UTM & State Plane
UTM and State Plane are classes of projections used for high quality hyper-local calculations. Not only do we support UTM and State Plane projections, but we also offer helper methods to quickly find which specific projection applies to your data. We have integrated overloads into many of our calculation methods for getting highly accurate results, ensuring that no matter what projection you're using, your calculations will be accurate and precise.
Sample Code
Batch Reprojection
In addition to on-the-fly reprojection, we also offer a number of batch reprojection APIs. These APIs will accept any number of points, lines, or polygons, and reproject them in a highly efficient manner.
Our projection APIs can also be applied to any of our feature sources as well, to reproject all of the data at once. By applying a projection to a feature source, you can interact with the reprojected data through our multitude of query tools. Once the data has been reprojected, you can also easily create a new feature source instance and export the data to a new file or database table.
Sample Code
Custom Projections
ThinkGeo APIs support your own custom projections based on the PROJ string format. This flexible string format allows you to specify a variety of factors, including the datum, unit, projection system, and spheroid model. In addition, we support inheriting and overloading of many of the projection-related methods, allowing you to implement your own projection math if needed. In this way, you aren't limited by the predefined parameters of PROJ and can use these overloads to support another projection library.
Sample Code
* Feature available, but no specific sample.