GIS Server - Beta Release
We’re excited to announce the beta release of the ThinkGeo GIS Server, a new developer control designed to turn your existing geospatial data into production-ready GIS services.
The GIS Server allows you to serve your GIS data in OGC-compliant formats that can be easily consumed by any client. Whether your client needs raster data (XYZ, WMS or WMTS) or vector data (GeoJSON, WFS or MVT vector tiles), the GIS Server has you covered.
Tip
Check out the GIS Server HowDoI samples here. Just clone the repo and run the solution in Visual Studio.
Use the Data You Already Have
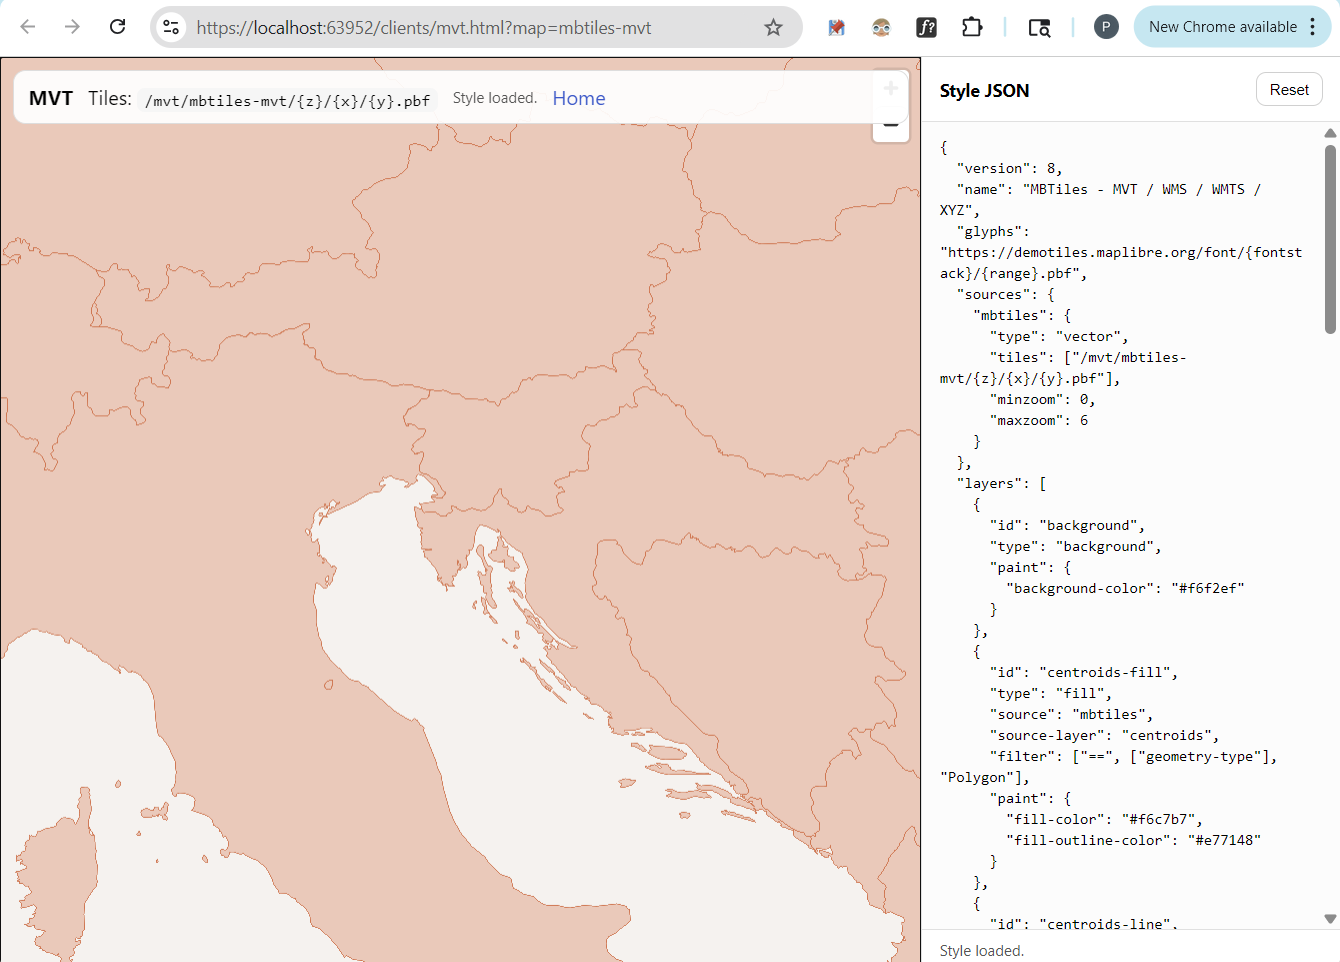
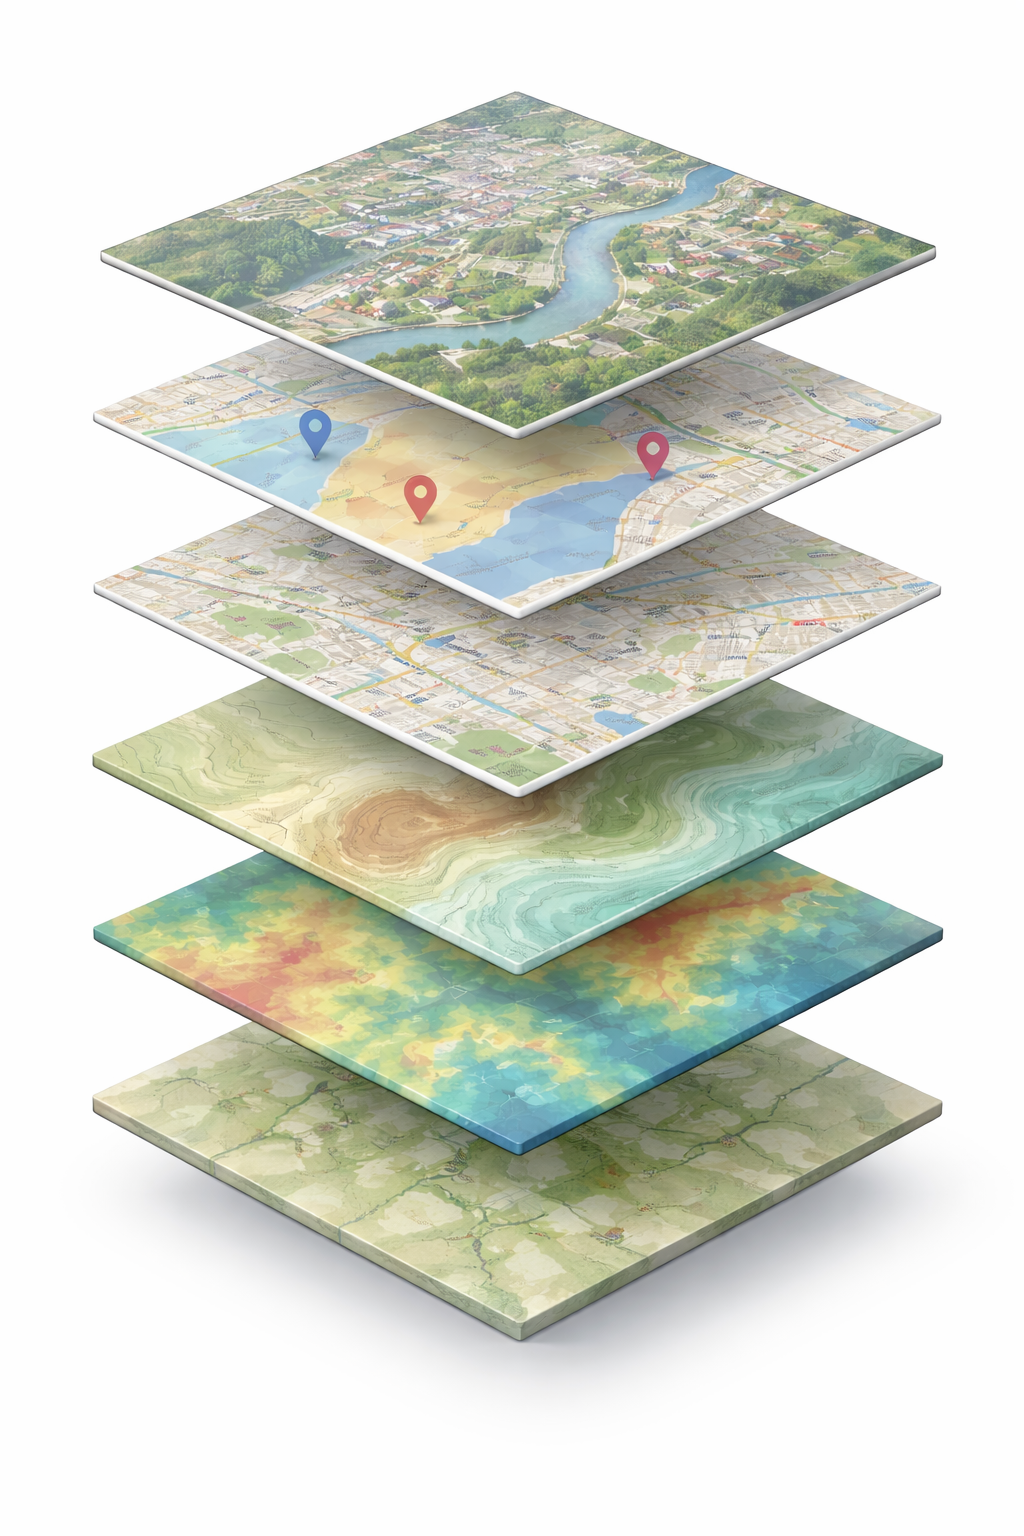
Figure 1 - GIS Server ‘HowDoI’ sample demonstrating the use of Mapbox Vector Tiles (MVT) and styling with a Style.json file.
The GIS Server is designed to work directly with your existing geospatial datasets - regardless of format. There’s no requirement to reprocess, migrate, or re-author your data before publishing it.
Supported input sources include:
Shapefiles
GeoTIFF
MBTiles (raster or vector)
PostgreSQL and SQL Server
Other common enterprise and file-based spatial formats
Simply point the GIS Server at your existing data sources and begin serving them immediately. For non-standard or custom datasets, the GIS Server is built on the same ThinkGeo.Core library used across ThinkGeo’s other products. This allows developers to extend core Layer, Style, and DataSource classes to support specialized data formats and advanced workflows when needed.
Multiple Output Formats from a Single Source
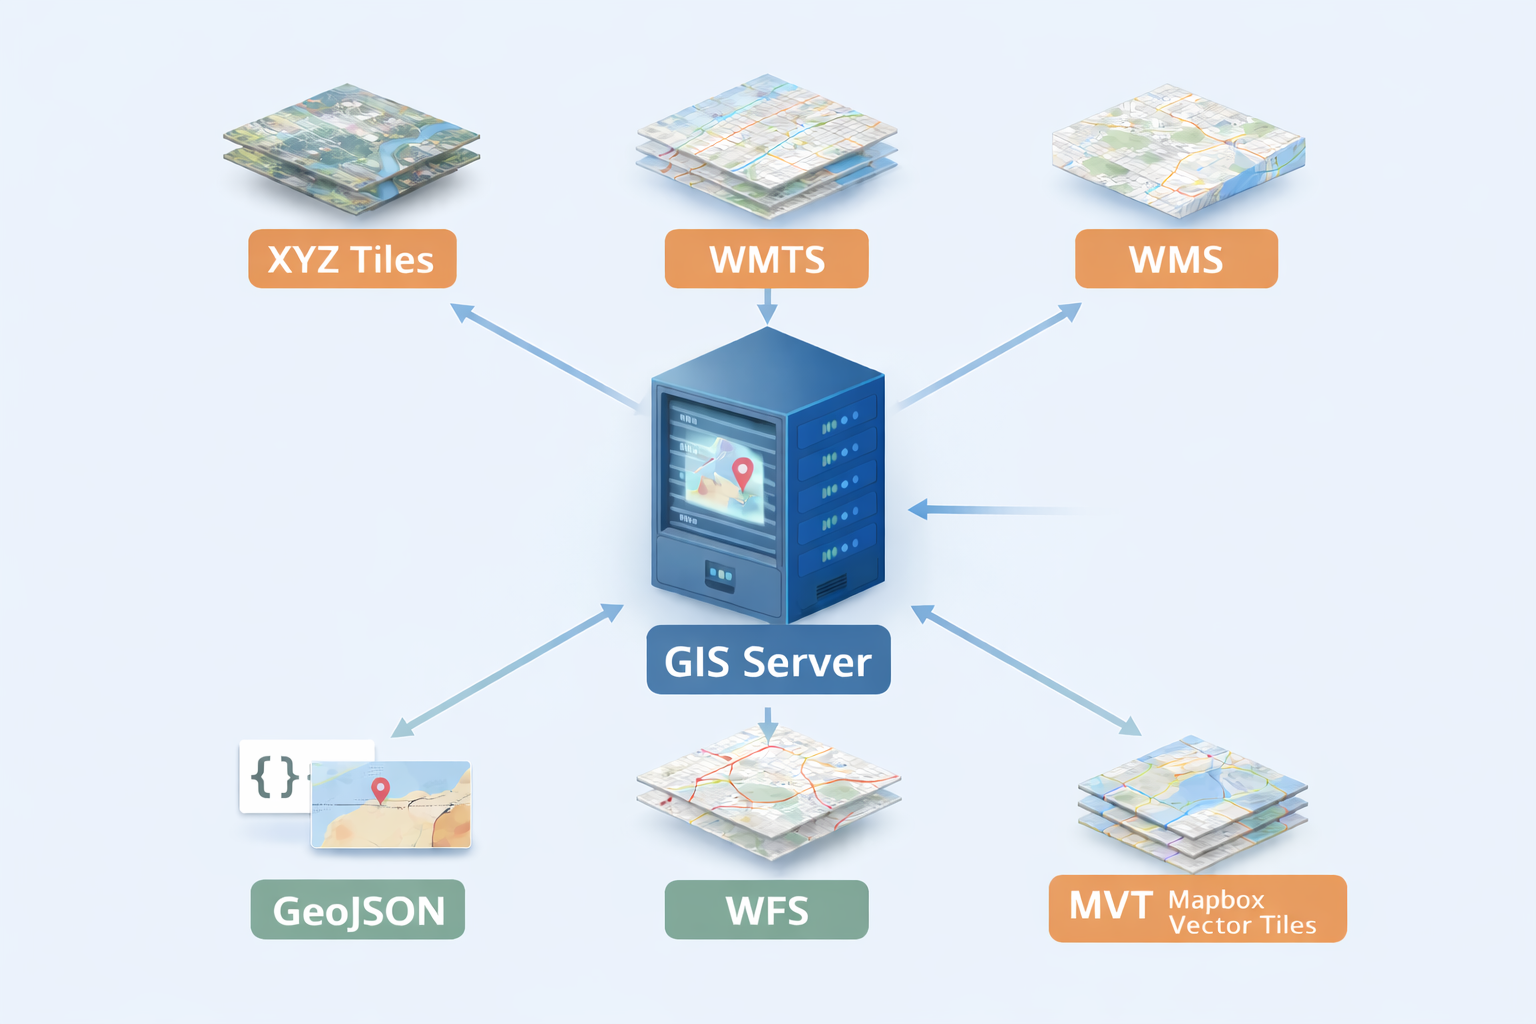
For each data source, the GIS Server can expose multiple service endpoints, allowing the same dataset to be consumed in different ways based on your client’s capabilities and performance requirements. Both raster and vector output formats are supported:
Raster outputs
XYZ tiles
WMTS
WMS
Vector and feature outputs
GeoJSON
WFS
MVT (Mapbox Vector Tiles)
This design lets you publish a single dataset as styled raster tiles, raw feature services, or high-performance vector tiles - using one unified GIS Server configuration while giving each client exactly the format it needs.
Choose Your Client
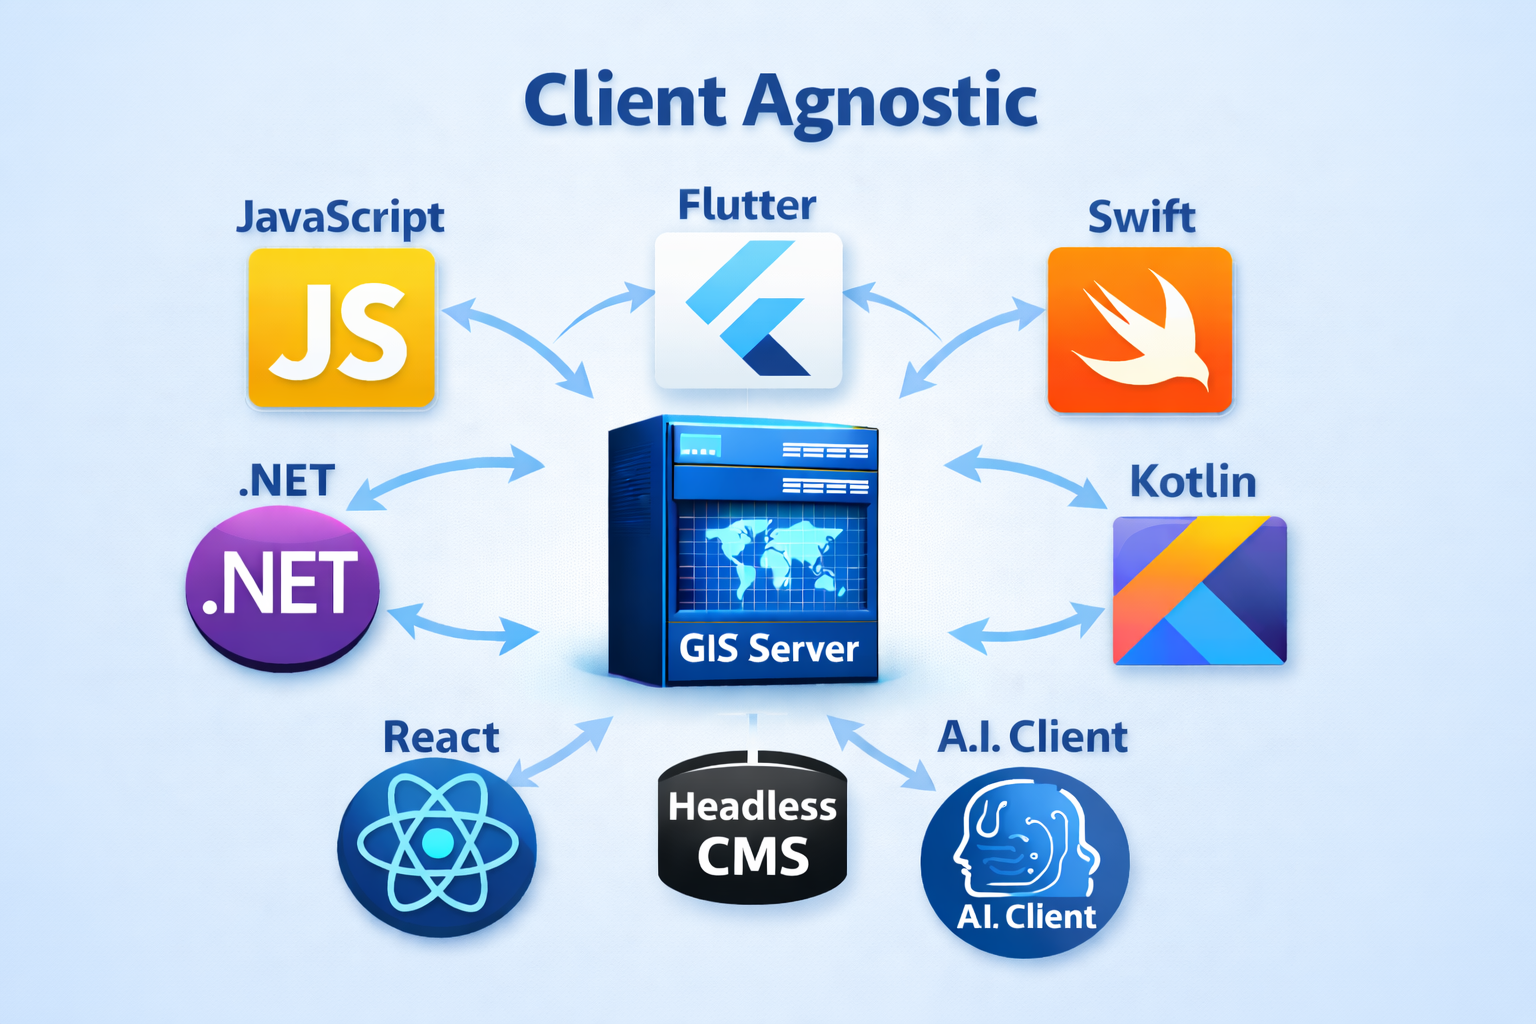
These standard output formats let you reuse your enterprise geospatial datasets across any client-side technology. Whether you’re building web maps, native or cross-platform mobile apps, offline desktop tools, or feeding data into AI and automation workflows, the GIS Server delivers data in formats that integrate cleanly with your application stack.
Although the GIS Server itself is implemented in C#, your client technology is entirely independent and driven by your project’s requirements.
In upcoming articles, we’ll walk through practical examples of using the GIS Server with many of today’s most popular client-side platforms, including:
Flutter applications using
flutter_mapand related pluginsReact Native apps with
react-native-mapsandmaplibre-react-nativeNative mobile development with Swift (iOS) and Kotlin (Android)
Desktop applications built with Python, Java, and WPF
Web applications using JavaScript frameworks such as React, Angular, and Vue
.NET cross-platform and web apps built with .NET MAUI, WPF/Winforms and Blazor
AI Workflows and Headless CMS clients such as ChatGPT, Claude, Strapi, Contentful or Sanity.
This flexibility makes it easy to standardize your geospatial backend while supporting a wide range of client experiences from a single GIS Server deployment.
Data Visualization and Styling
The GIS Server offers flexible server-side styling options, allowing you to control how your maps are rendered before they ever reach the client. In addition to core point, line, and area styles, it includes a wide variety of built-in thematic styles - such as heat maps, class breaks, and isolines - designed to handle common geospatial visualization needs out of the box.
When the built-in options aren’t enough, you can easily extend existing styles or create entirely custom styles to meet specialized requirements.
For client-side styling workflows, simply expose your data using a vector-based output such as GeoJSON, WFS, or MVT, and apply styling directly in your client framework - whether that’s JavaScript mapping libraries, mobile SDKs, or desktop UI toolkits. This gives you the flexibility to choose between centralized, server-managed styling and fully client-driven visualization.
Powerful GIS Functionality

If your source datasets use different coordinate systems than your target map, the GIS Server handles reprojection for both raster and vector data automatically. Like other ThinkGeo components, the GIS Server is built on PROJ, the widely adopted open-source projection library that supports thousands of coordinate reference systems worldwide.
To simplify configuration, the GIS Server provides APIs that let you identify and apply projections using standard SRIDs or PROJ projection strings. This makes it easy to align disparate datasets into a single, consistent spatial reference system for delivery to your clients. A comprehensive list of supported projections can be found here.
Code Walkthrough
The sample below was taken from the GIS Server HowDoI Samples. We encourage you to clone the repository and experiment with your own data.
The first step is to create a new class that inherits from the ThinkGeo.GisServer.IWebServerModule interface and declare a few constants for the service title and description which will be used later in the sample:
// Registers all web services using a shapefile dataset that renders in EPSG:3857 via a ProjectionConverter.
internal sealed class Shapefile_WmsWmtsXyzWfsGeoJsonModule : IWebServerModule
{
    private const string Id = "shapefile-all-services";
    private const string Title = "Shapefile - XYZ / WMTS / WMS / WFS / GeoJSON";
    private const string Description = "Publishes a shapefile dataset through XYZ/WMTS/WMS/WFS/GeoJSON. Raster output renders in EPSG:3857.";
The next step is to implement the Register method. This is the most important method and allows you to load your data sources, style the data (for raster outputs) and specify which output formats your service will support. The GIS Server uses the ThinkGeo.Core library which will allow you to reuse your custom styling and data source codebase from other ThinkGeo projects.
In the code below, you can see how a shapefile is loaded, then a VectorLayerDefinition and RasterLayerDefinition are used to configure the layers with the appropriate data sources, projection converters and styling (for raster outputs).
    public void Register(ThinkGeoWebServerOptions options)
    {
        ArgumentNullException.ThrowIfNull(options);
        var contentRootPath = SampleRegistration.GetContentRootPath();

        // This sample publishes the same dataset through all services.
        var shapefilePath = Path.Combine(contentRootPath, "App_Data", "Shapefile", "Countries02.shp");

        // set up our Vector Layers that will be used for WFS and GeoJSON.
        var vectorLayers = new[]
        {
            new VectorLayerDefinition
            {
                Name = "countries",
                Title = "Countries",
                IsQueryable = true,
                CreateFeatureSource = () => new ShapeFileFeatureSource(shapefilePath)
            }
        };

        // set up and style the raster layers which will be used in the XYZ, WMS and WMTS endpoints.
        // note:  the raster layers are styled on the server and any ThinkGeo styling can be applied here.
        var rasterLayers = new[]
        {
            new RasterLayerDefinition
            {
                Name = "countries",
                Title = "Countries",
                CreateLayer = () =>
                {
                    var layer = new ShapeFileFeatureLayer(shapefilePath);
                    layer.FeatureSource.ProjectionConverter = new ProjectionConverter(4326, 3857);

                    layer.ZoomLevelSet.ZoomLevel01.DefaultAreaStyle = AreaStyle.CreateSimpleAreaStyle(
                        GeoColors.PapayaWhip, GeoColors.DarkGoldenrod, 1);
                    layer.ZoomLevelSet.ZoomLevel01.DefaultTextStyle = TextStyle.CreateSimpleTextStyle(
                        "CNTRY_NAME", "OpenSans", 9, DrawingFontStyles.Regular, GeoColors.Black, GeoColors.White, 2);
                    layer.ZoomLevelSet.ZoomLevel01.ApplyUntilZoomLevel = ApplyUntilZoomLevel.Level20;

                    return layer;
                }
            }
        };
The last step is to simply define your output formats and assign the layers to the outputs - that’s all there is to it!
        // Set up our Outputs in all the Vector and Raster formats you want the service to support.
        var xyzMap = new XyzMapOptions
        {
            Name = Id,
            Title = Title,
            Abstract = Description,
            Crs = "EPSG:3857",
            MapUnit = GeographyUnit.Meter,
            FullExtent = MaxExtents.SphericalMercator,
            TileMatrixSetId = "GoogleMapsCompatible",
            BackgroundColor = GeoColors.White,
            RasterLayers = rasterLayers
        };

        var wmtsMap = new WmtsMapOptions
        {
            Name = xyzMap.Name,
            Title = xyzMap.Title,
            Abstract = xyzMap.Abstract,
            Crs = xyzMap.Crs,
            MapUnit = xyzMap.MapUnit,
            FullExtent = xyzMap.FullExtent,
            TileMatrixSetId = xyzMap.TileMatrixSetId,
            BackgroundColor = GeoColors.White,
            RasterLayers = rasterLayers
        };

        var wmsMap = new WmsMapOptions
        {
            Name = xyzMap.Name,
            Title = xyzMap.Title,
            Abstract = xyzMap.Abstract,
            Crs = xyzMap.Crs,
            MapUnit = xyzMap.MapUnit,
            FullExtent = xyzMap.FullExtent,
            BackgroundColor = GeoColors.White,
            RasterLayers = rasterLayers
        };

        var vectorMap = new VectorMapOptions
        {
            Name = xyzMap.Name,
            Title = xyzMap.Title,
            Abstract = xyzMap.Abstract,
            Crs = "EPSG:4326",
            MapUnit = GeographyUnit.DecimalDegree,
            FullExtent = MaxExtents.DecimalDegree,
            VectorLayers = vectorLayers
        };

        options.Xyz.Maps[xyzMap.Name] = xyzMap;
        options.Wmts.Maps[wmtsMap.Name] = wmtsMap;
        options.Wms.Maps[wmsMap.Name] = wmsMap;
        options.Wfs.Maps[vectorMap.Name] = vectorMap;
        options.GeoJson.Maps[vectorMap.Name] = vectorMap;

        // No sample-specific service options are needed here because this sample uses
        // the default GoogleMapsCompatible matrix set and global service settings.
    }
Connect With Us
We hope you found today’s post useful. If you have questions or topics you'd like us to cover in future posts, we’d love to hear from you! Email us at sales@thinkgeo.com or schedule a meeting to talk in person. We always enjoy connecting with our customers, learning how you’re using ThinkGeo, and exploring new ways to improve our products.
About ThinkGeo

We are a GIS software company founded in 2004 and located in Frisco, TX. Our clients are in more than 40 industries including agriculture, energy, transportation, government, engineering, IT, and defense.
We pride ourselves on our excellent service and transparency. ThinkGeo offers a variety of products and services to meet almost any GIS application need. We can even help you develop your next project - anywhere from a few hours of consulting to outsourcing an entire project. To learn more, email us at sales@thinkgeo.com, or call us direct at 1-214-449-0330.