Geometric Operations
Working with Geometries
Geometric operations help to modify or create new geometries based on your use cases. In many scenarios, geometric operations are just one step in a larger set of operations. For example, you might start with a spatial query, apply several geometric operations, and apply another query or add the results to a layer.
A real-world example of this might be for a marketing campaign. Let's assume you have a number of stores in a large area and want to find all of the households within a certain radius of each store, but you want to avoid overlapping advertising on stores close together. In this case, you would start by quering all of the stores (as points) in the area and creating a 1 mile buffer around each store, resulting in a number of circles representing the area around each store. Next, you could loop through all off these circles, find the differences, and clip any overlapping polygons. Finally, you would do another set of spatial queries to find all of the households in each of these polygons, which would represent the customers associated with each region.
Translate
Translating a feature is a fancy way to say you’re moving it. When translating a feature, you can move it based on a new center point or move it a certain distance in a direction relative to the current position.
An example where translation might be useful is predicting the path of a storm. You might have a polygon representing the storm's footprint, and translate it a distance and direction based on the current direction and speed of the storm. After the translation, you could also do a spatial query against a layer of buildings to see how many will be affected.
Sample Code

Rotate
This operation allows you to rotate a feature based on a number of degrees around given center point. In this way, you can rotate features not only based on the center of the feature, but around another axis of rotation, which is often useful.
An example of a situation where you would need to rotate something based on a point other than its center is for hazardous chemical plumes. Every hazardous chemical has a plume model which defines the size and shape of its plume. The direction of the large part of the plume is based on the source of the spill and the wind direction. If the wind shifts, you can rotate the plume based on the tip and the larger point of the plume will shift to match.
Sample Code

Scale
The scale operation allows you to scale up or down a polygon or line based on a percentage of its original size. Scaling a feature is something often done for areas, such as an exclusion zone that needs to be expanded.
Typically, scaling comes into play with editing features that are drawn by users allowing them to grab a control point and scale them up or down. While you can do this manually, ThinkGeo also has many built in editing features that leverage this API and give your end users an easy way to do this.
Sample Code

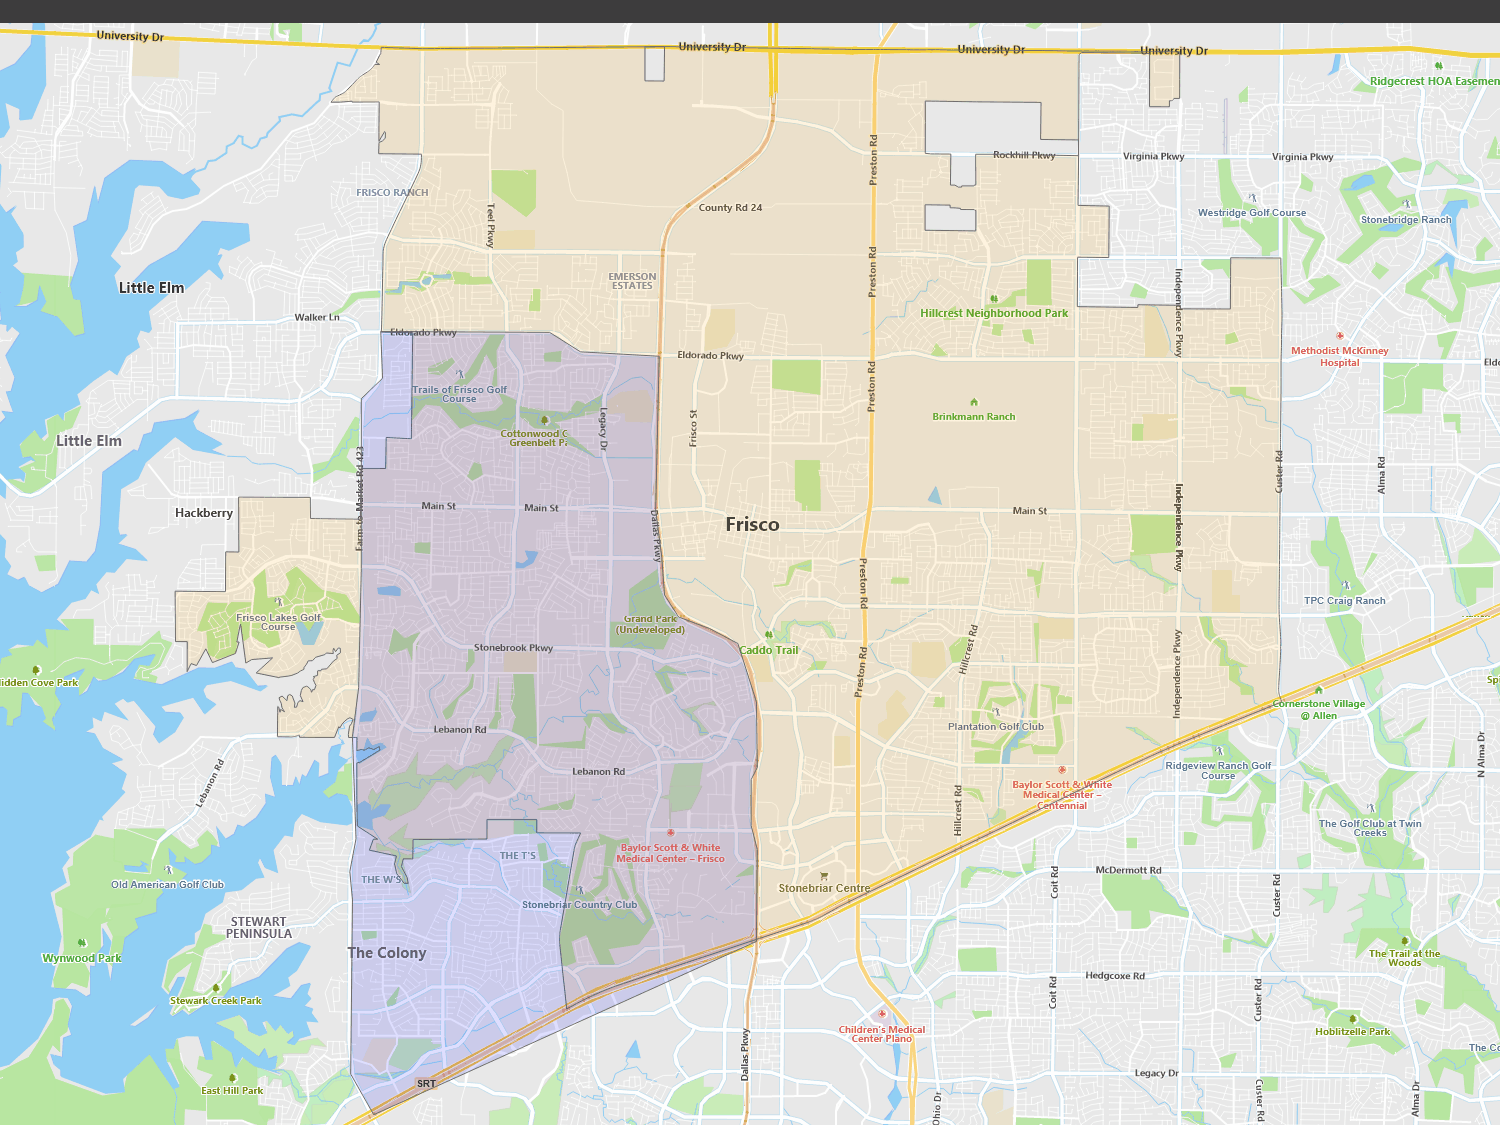
Union
The union operation combines shapes that are passed in and returns a single polygon or multi polygon shape. If any of the boundaries of the polygon are touching, it will merge them and remove the shared boundary. If the original shapes are not touching, the result will be a single multi-polygon with multiple outer rings that are disconnected.
Unions are very common operation and especially helpful in analysis. For example, you might want to know the total area coverage of multiple radio towers, each of which has a specific effective radius. To prevent loss of signal, the towers are placed in a way where the signal area overlaps. To get the total area, you can union the effective circles of all of the towers, and then get the total area of the single multi polygon that's returned.
Sample Code

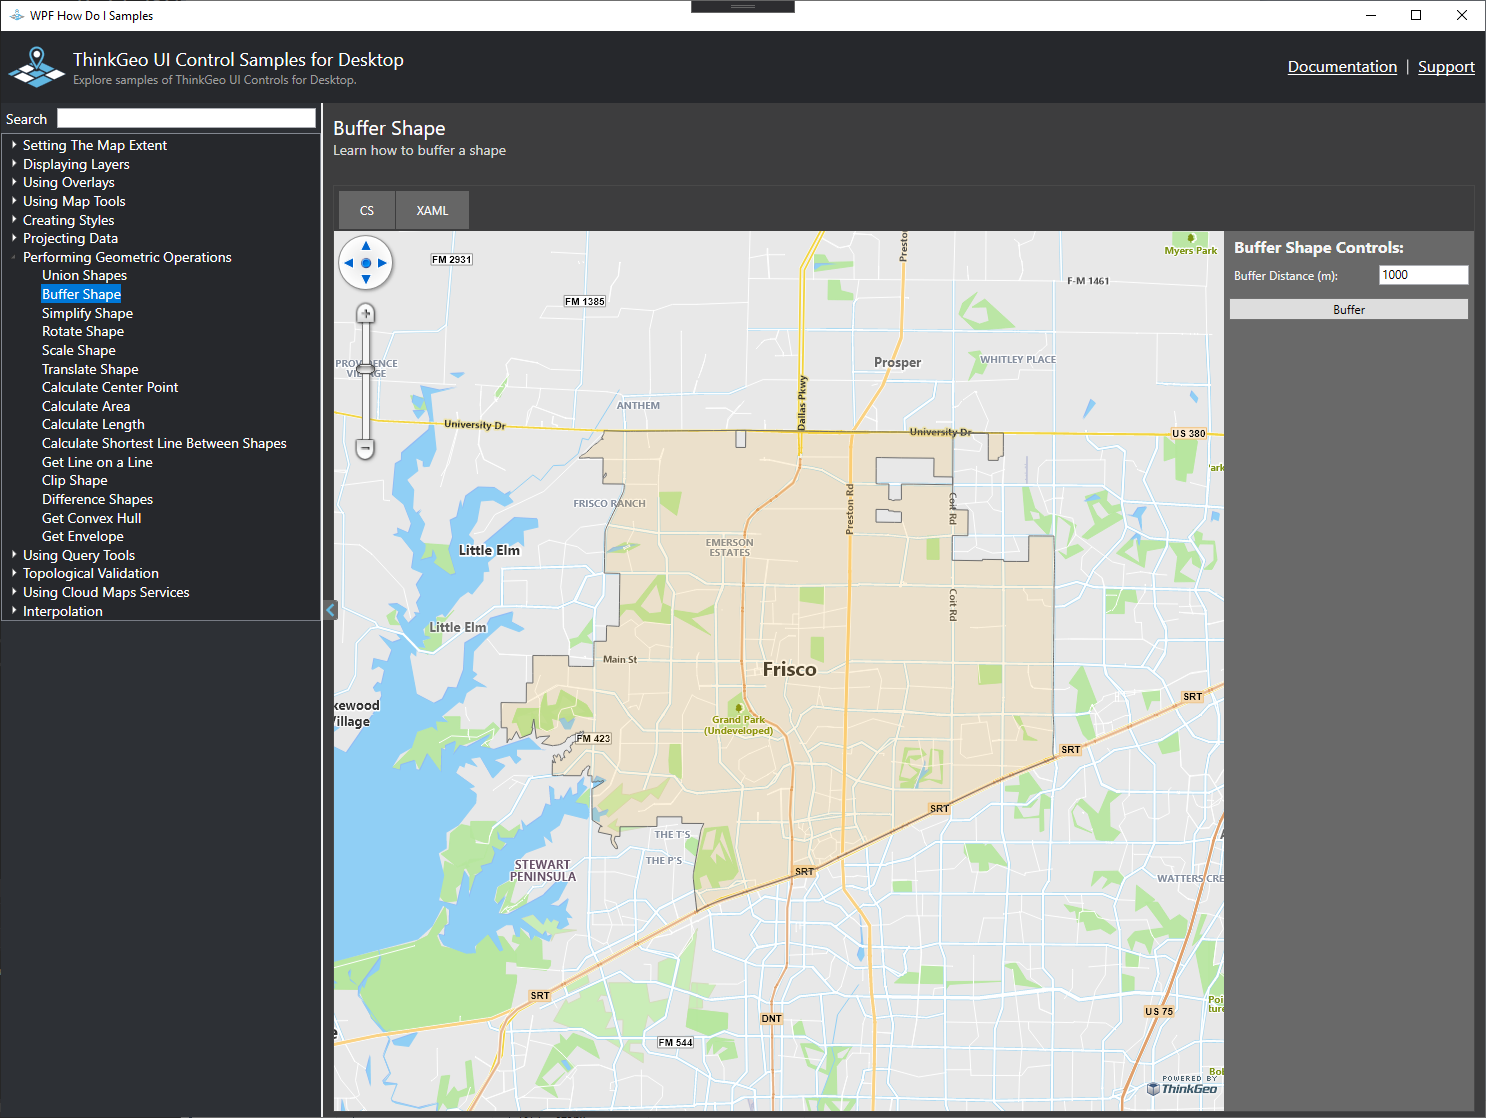
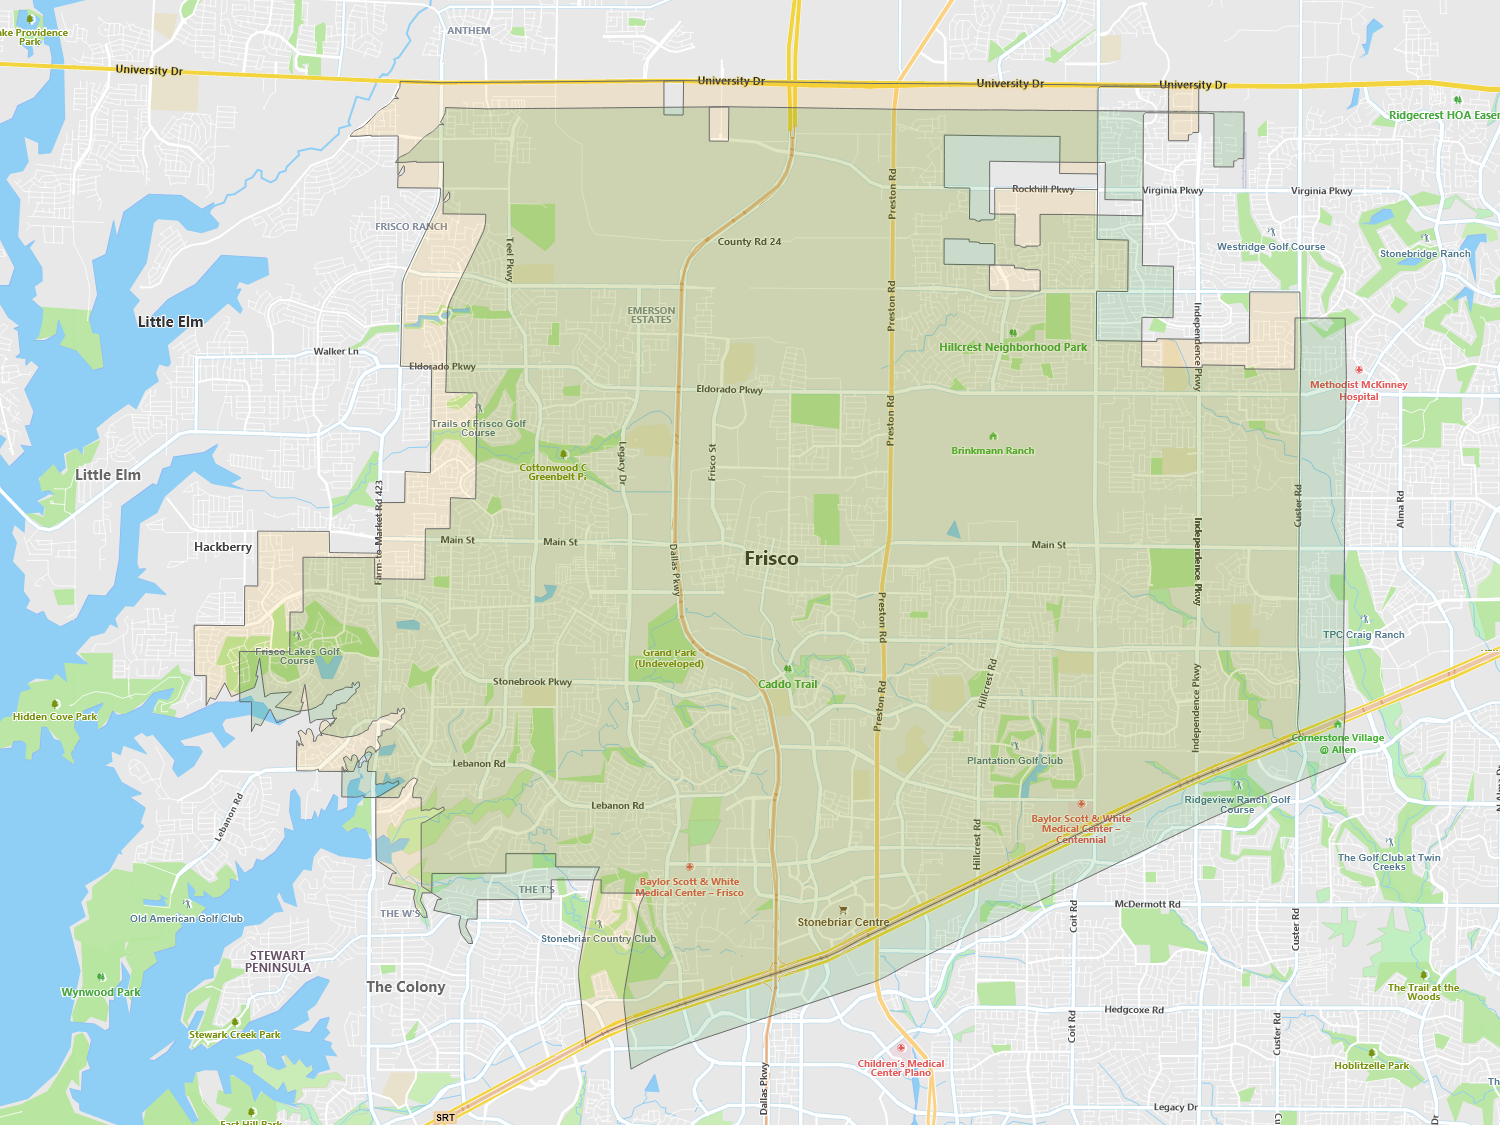
Buffer
Buffering allows you to create an area outside of the bounds of a geometry, based on an input distance. Buffers are very useful in analysis, especially when finding things that are a certain distance away from a geometry.
A common case where buffering is useful is finding all of the gas stations along a route. Starting with a line representing a route, you can buffer that line with a distance of 1 mile, creating a 1 mile wide corridor along the route. You could then query the gas stations dataset to find all of them within that polygon. If you only wanted gas stations close to you, then you could simply clip the line from your current location to a short distance towards your end point, and do the same operation. This would return you all of the nearby upcoming gas stations.
Sample Code

Simplify
Simplification allows you to remove vertices without changing the overall shape of the feature. When you create features, you want to have have the highest level of detail possible for analysis. For displaying features, however, you want their level of complexity to match the scale at which they are being displayed. Too much detail at a higher level means not only will you miss details, but performance will also be impacted due to the number points being drawn. Simplifying a shape allows you to improve the drawing performance without giving up visual details.
An example where you would want simplifications would be when working with a complex property boundary. You want the data at the highest possible resolution for measurements like the area. At the same time, you may want to make a few simpler versions of the shape, so that as the user zooms out they are shown a more simplified version that renders faster.
Sample Code

Clip
Clipping allows you to pass in a two features and get the area they share, while keeping the attributes of the first feature. This is handy when you want to know the area two shapes share in common.
An example might be if you have a county polygon and a polygon that represents an evacuation area. You could clip the portion of the school zone that overlaps with the evacuation zone, and then send that clipped polygon to the school district to take appropriate action.
Sample Code
Difference
The difference operation shows the area that two shapes do not share in common. There are two types of difference operations, symmetrical and asymmetrical. In a symmetrical difference, the operation returns the area not in common for both of the input shapes. In an asymmetrical difference, the operation only returns the area not in common for one of the shapes.
Sample Code

Convex Hull
A convex hull is the smallest possible convex shape (not crossing in on itself) that completely covers a feature. It is useful as a simplified version of the feature that is not concave. The shape being convex is important, as there are a number of algorithms that calculate various things (for exmaple - point in a polygon, overlap, difference) that have faster implementations assuming that a shape is convex. In many cases, the difference in speed is huge.
A situation where this might be useful is when executing millions of' point in polygon' operations against a set of complex polygons. For optimum performance, your first step would be to compare the point to the envelope of the polygon, and if the point is not inside of that then it could not be inside the polygon. While this is a reasonable approach, an envelope can be be very large for certain polygon configurations, and checking each polygon that matched might not be optimal. A better strategy would be to also calculate the convex hull as well, and check both the envelope and the hull. Then, we only have to check the actual geometry if both are postive.
Sample Code

Envelope
The envelope of a shape is the smallest rectangle that contains a shape. It’s arguably the most useful shape in GIS applications. An envelope is made up of only an upper right and lower left coordinate, making it compact, quick to calculate, and very efficient for mathematical operations. Because of this, it’s at the heart of nearly all spatial indexes, as well as being very useful as a first check to see if a particular shape is a candidate for a spatial operation in relation to another shape.
Sample Code
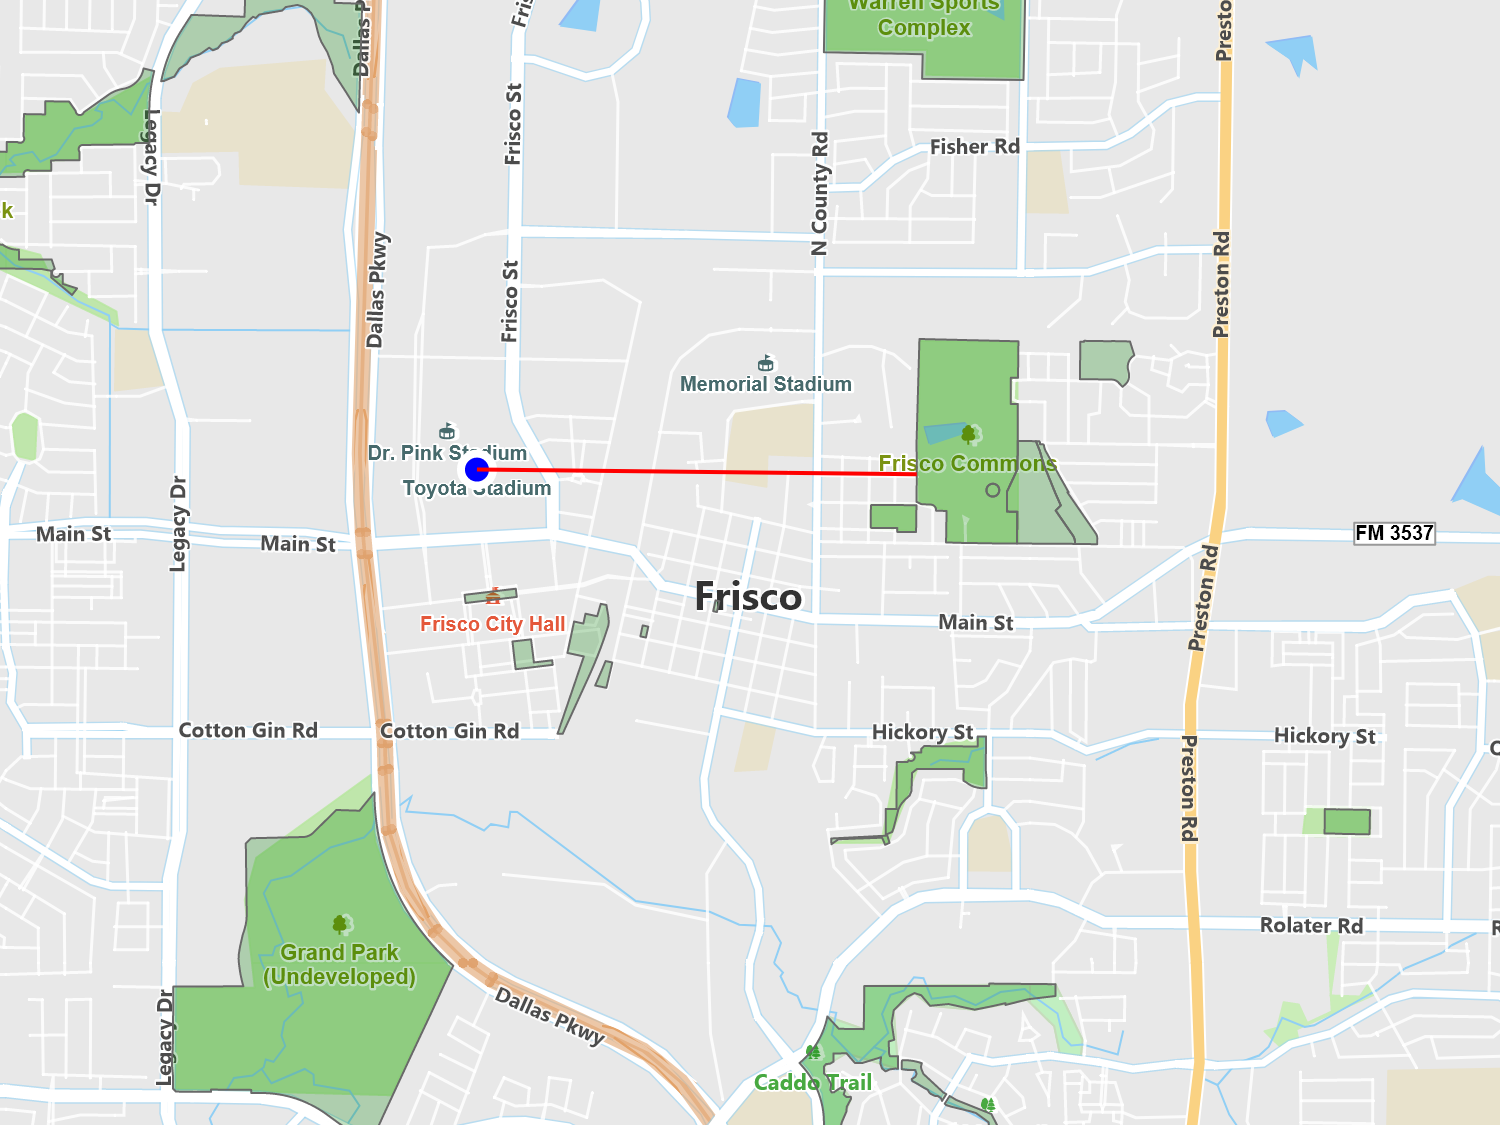
Shortest Line
The shortest line operation allows you to find the shortest path between two geometries. The path is always calcualted to the exterior of the geometry and is always a straight line assuming a planar grid. In decimal degrees your shortest line may curve, similarly to how airline routes seem to curve on the map due to the nature of the decimal degree system.
As eluded to above, one use of the shortest line operation would be to calculate the route a ship might take while at sea. This returns you a line of coordinates which may not appear straight, but will be the shortest path in the real world.
Sample Code

Additional Operations
Center Point - The center point of a geometry can be calculated based on the envelope of the shape or the center of gravity.
Area - The area of a geometry can be represented in a number of supported area units.
Length - This is the length of a geometry (and in the case of polygons, the length of the polygon boundary).
Sample Code
* Feature available, but no specific sample.
<<
Previous
>>