ThinkGeo Basics: Styles

This is the second post in our ‘ThinkGeo Basics’ series where we introduce new GIS developers to the basics of building a map. A while back we discussed Feature Sources which can be viewed here. Today we’ll explore how to visualize your map data using styles.
In GIS, styles control how your map looks. From the color of a line or polygon to the symbol on a point, styles determine how every Feature on your map will render. In ThinkGeo, there are 4 basic Style classes listed below:
LineStyle: Line styles are used to style all of your line features (roads, pipelines, powerlines, etc.) LineStyles can be built with any color, opacity and inner/outer pen combinations to accommodate any requirements you may have.
AreaStyle: You should use this class to draw polygon features. Typically this will be countries/states/counties, fields or parcels. You can specify a fill brush to draw the interior and an outline pen to draw the border. You can optionally choose to use only the outline pen or the fill brush, which enables you to generate different effects.
PointStyle: This class is used to style all point features. Point features can be cities or towns, homes or any other point such as drill values or soil PH samples. There are three main drawing types: bitmap, character, and symbol.
TextStyle: This class is used for labeling features on the map. You can set the font you want to use to label, the TextBrush to define the color and look of the text, and the TextColumnName you want to use for the text to draw. Many more properties can be viewed in our ‘HowDoI’ samples here.
In addition to these basic styles, there are many other more specialized styles that can be used to effectively display your data:
FilterStyle: This style allows you to selectively style features based on conditions in the attributes of the data. An example would be displaying different symbols based on each point’s type such as restaurant or gas station.
HeatStyle: The HeatStyle allows you to better visualize data by making areas of high concentration "hotter" using warmer colors and low density areas visually cooler.
ClusterPointStyle: A great tool to use when you need to cluster (group) and count your point data.
ClassBreakStyle: The ClassBreakStyle allows you to change the way features are drawn based on their data values. It is often useful for you to display features differently based on ranges of numeric values. For example, you may have a states ShapeFile that has the populations of each state as part of its data. You may then want to color states differently based on their population. The ClassBreakStyle allows you to do this.
DotDensityStyle: This class allows you to display information by drawing points on an area based on a value from the features data. The higher the value is in the data, the greater the number of points that are drawn. The points themselves are distributed randomly inside of the polygon.
RegexStyle: The RegexStyle allows you to use complex regular expression matching to determine how your features are drawn.
ValueStyle: The ValueStyle allows you to match data in the FeatureSource against a value string.
All the styles above and many more can be viewed in our ‘HowDoI’ samples here.
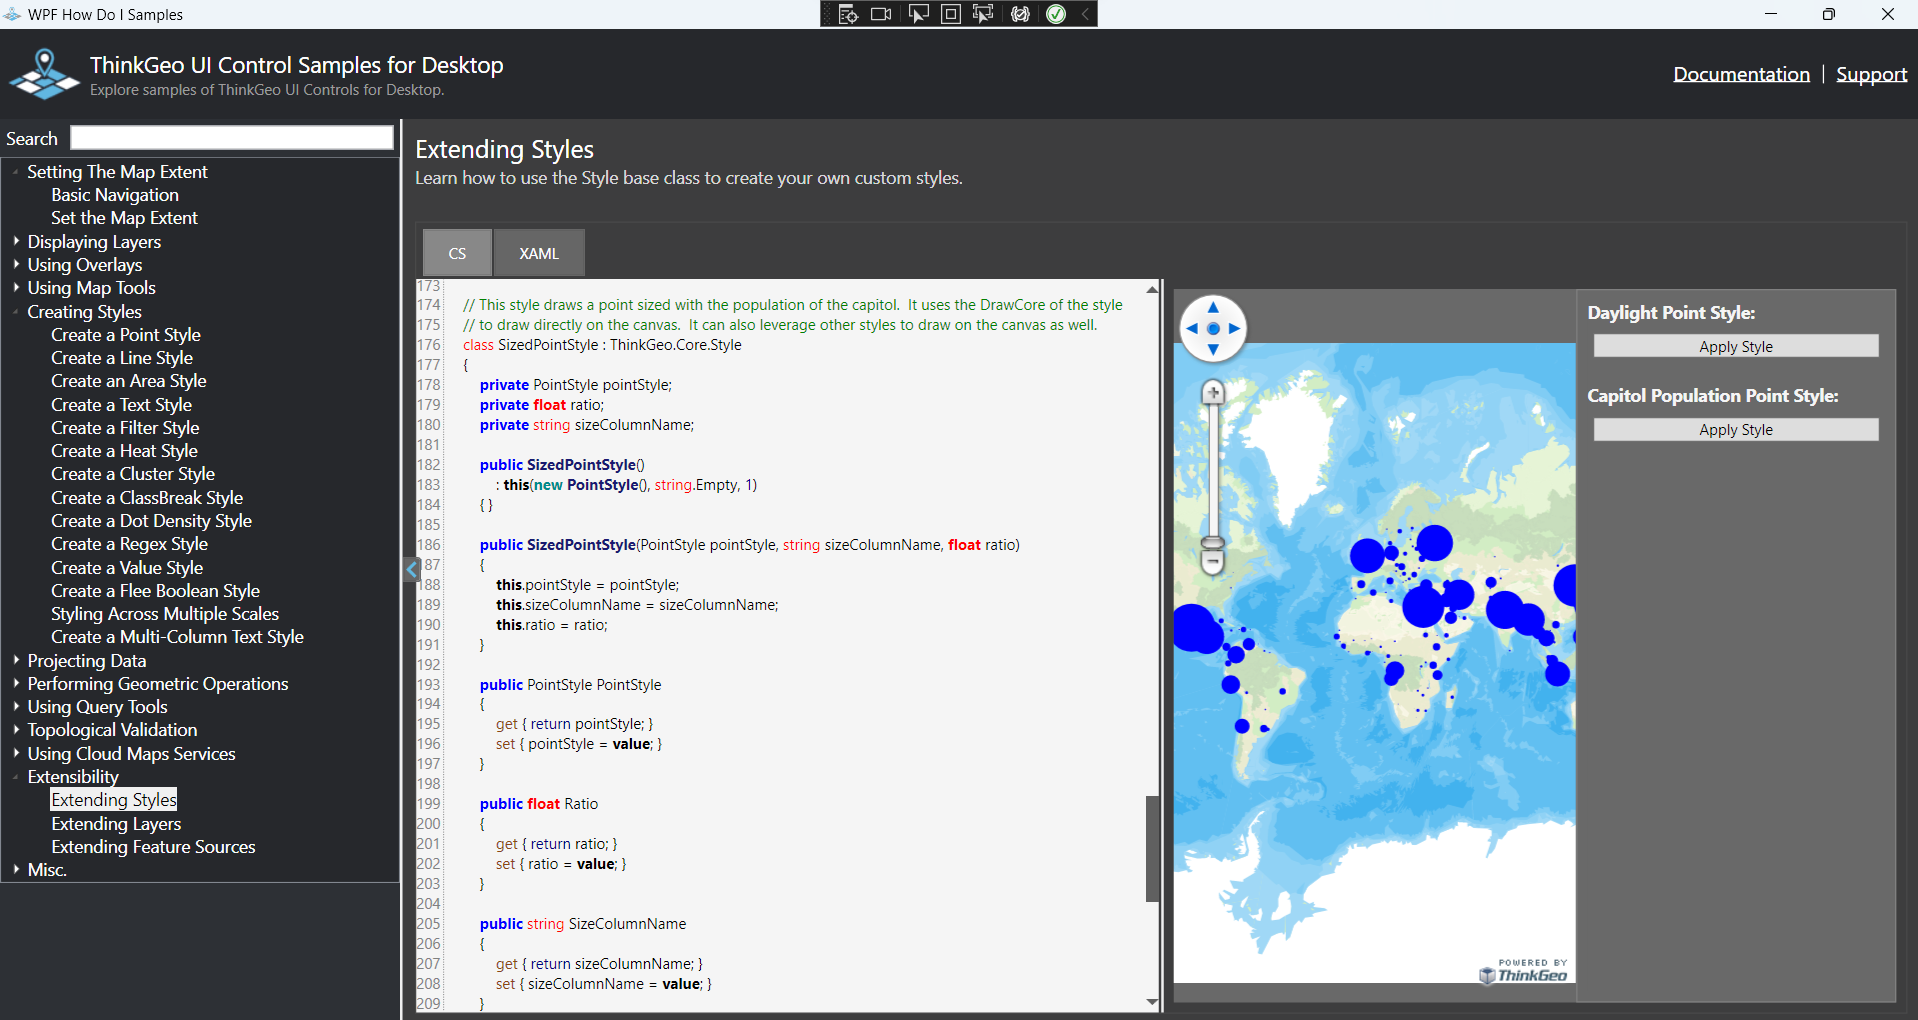
If you need a style that is unique to your data or requires specialized styling, you can check out our Extensibility Guide. This guide dives deeper into the specifics of extending ThinkGeo styles to suit your specific needs. We also have an example of Extending Styles in our ‘HowDoI’ samples here - just look for the ‘Extending Styles’ under the Extensibility section.
The Extending Styles example demonstrates how to create 2 unique custom styles. One that sizes points based on population and another that styles points based on their location and time of day.
Good luck on your journey into GIS. The first step is to sign up for a free evaluation and start building today!
If you have any questions or specific needs, we encourage you to contact sales@thinkgeo.com and we will be happy to assist.