

ThinkGeo’s Coronavirus (COVID-19) Live Map
Mapping epidemics and adding visual details can help greatly in understanding and locating the spread and epicenters of viruses like COVID-19.

Restoring OpenStreetMapLayer Functionality in ThinkGeo UI
Are you using the ThinkGeo UI OpenStreetMapLayer in your application and experiencing problems with map tiles not loading? This may be due to recent changes on OpenStreetMap’s side in which they are more strictly enforcing their Tile Usage Policy. This policy requires (among other things) that any application consuming tiles from OpenStreetMap’s servers must identify itself with a valid HTTP User-Agent. By default, ThinkGeo’s OpenStreetMapLayer does not specify a User-Agent, but you can (and should) set one yourself.

ThinkGeo Route Optimization solves the Traveling Salesman Problem
ThinkGeo Cloud Routing has kicked off the new year with the addition of the Route Optimization service, which introduces the ability to tackle the Traveling Salesman Problem or TSP as it’s commonly known.

Make a Web Mapping App with Routing and Place Search: Tutorial
“We’ve got a long way to go and a short time to get there”; an excerpt from Jerry Reed’s classic record “Eastbound and Down”. Within those lyrics resides a deeper story of managing time and distance across the roads of America. There were no data hubs in Jerry’s days of trucking and fleet management. There were no ways of saving time beyond those that could be thought up on a whim.

Applying a Directional Styling in a WPF Application
This ThinkGeo WPF ApplyDirectionPointStyleForLineStyle functionality for .NET Core will guide you through drawing lineStyles in the form of directional arrows on a map. The direction Point can be an image or a glyph, it not only rotates the icon across the angle of the road, but also provides a way to customize the rotation of the direction point.

Using “ClassBreak” styling to create dynamic maps
In this project you will see how to use the ClassBreakStyle to group and render features by values. ClassBreakStyle is a useful technique as it allows you to group various features by the specified values, then applies differently style to the feature groups. One of the first steps in creating an interactive map that highlights different classes of data is creating unique iconography to translate that onto the map.

Using WPF “TextStyling” with ThinkGeo UI
When you think of displaying points on a map, usually you think of representing them with symbols or icons. ThinkGeo’s PointStyle class is typically employed here, but what if you have a font containing symbols you want to use?

Video Spotlight: Getting Started with ThinkGeo UI 12 & WPF
ThinkGeo UI WPF for .NET Core takes GIS application development for the Windows desktop to a whole new level, with a .NET Core-native control that packs the full power of Windows Presentation Foundation (WPF). With blazing fast rendering performance, powerful mapping features and support for the most popular data formats, ThinkGeo UI Desktop WPF for .NET Core makes GIS accessible to developers of any skill.

Video Spotlight: Getting Started with ThinkGeo UI 12 & Blazor
With the release of ThinkGeo UI 12, we’ve had a lot of interest in the new Blazor map component introduced with it. Today we’re offering a look at how to add a map to your Blazor web application in just a few lines of code.

ThinkGeo UI 12 Arrives with .NET Core 3.0 & Blazor Support
Say hello to the all-new ThinkGeo UI 12. Powered by .NET Core 3.0, our new map controls are modern, cross-platform, fast, and packed with features like Blazor support and cloud integration. Our full suite of ThinkGeo UI 12 products is available right now — read on to discover what’s new.
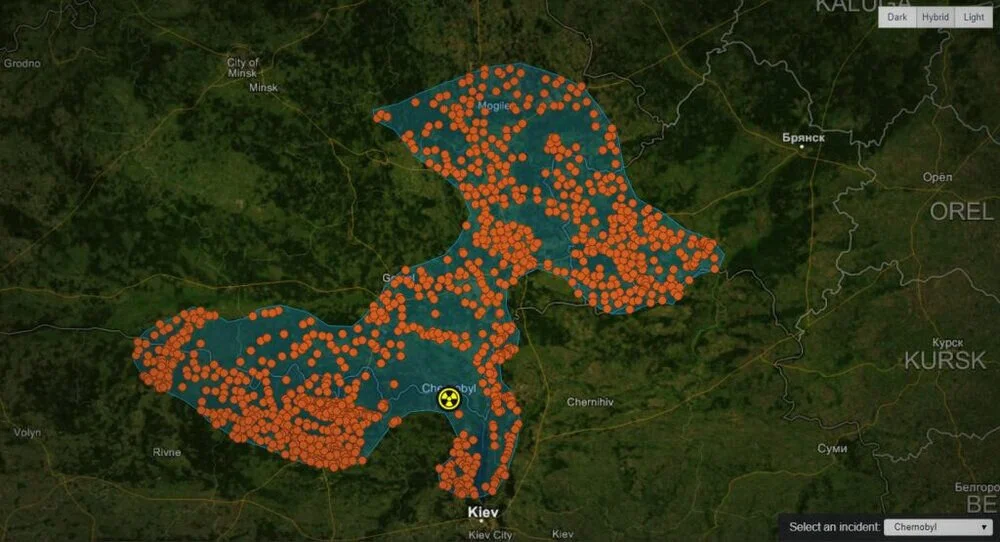
ThinkGeo Maps Query Sample Spotlight: Cities Affected by Nuclear Disasters
There have been a handful of nuclear power plant events that have had significant consequences for people, the environment and the facilities and workers of the plant. Sometimes the scope and radius of the area impacted by these events is minimized or not completely understood. Maps can help in painting that picture. ThinkGeo Cloud can go the extra mile and stress the importance and the magnitude of such events.

Routing Cost Matrix API added to ThinkGeo Cloud
Sometimes getting from point A to point B just isn’t enough. Sometimes there are points C-Z to factor into consideration and if that’s the case then odds are you need to know how long it’s going to take to get there too. Enter ThinkGeo’s Routing Cost Matrix API. This latest addition to our ThinkGeo Cloud arsenal introduces a simple service that calculates the time and/or distance between several waypoints.
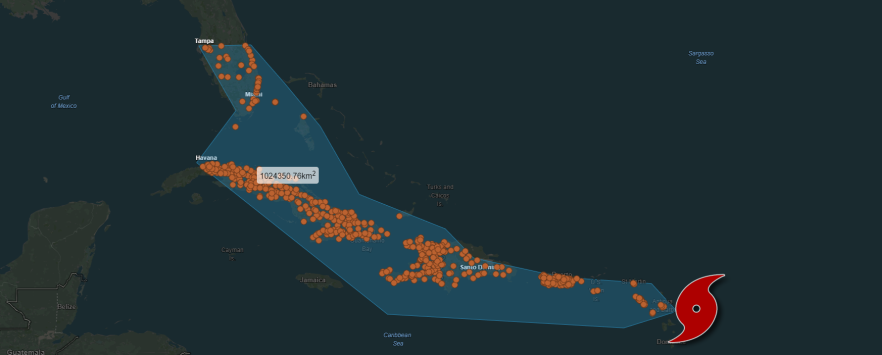
Maps Query Service added to ThinkGeo Cloud
ThinkGeo’s Cloud Maps Spatial Query Service is a data allocation haven. With it, you can free-draw, set lines and/or polygon contours for any portion of ThinkGeo’s World Maps and then extract a bevy of spatially-related data.

ThinkGeo Routing Sample Spotlight: Finding Places of Importance Along Your Route.
“We’ve got a long way to go and a short time to get there” ; an excerpt from Jerry Reed’s classic record “Eastbound and Down”. Within those lyrics resides a deeper story of managing time and distance across the roads of America. There were no data hubs in Jerry’s days of trucking/fleet management. There were no ways of saving time beyond those that could be thought up on a whim.